Beyond the NET: The ‘Wins Above Bubble’ Reality Facing New Mexico’s Final Five Games


Every possession matters.
And for every mid-major basketball program, it maybe matters just a little bit more.
Selection Sunday is just under four weeks away and we are starting to see the Mountain West crème de la crème rise to the top. Utah State (23-3, 13-2 MW) sits squarely in first place with a full game lead over San Diego State (18-7, 12-2 MW) and two games over New Mexico (20-6, 11-4 MW). With five games remaining in conference play before the MW Tournament starts, the narrative around the league has been about how the conference has collectively had a down-year. Thus prompting the question, how many teams get into the Big Dance in 2026?
From a historical standpoint, the Mountain West Conference has notably been one of the most successful mid-major conferences in sending teams to the NCAA Tournament.
The conference has sent four-plus teams to the Big Dance in four consecutive seasons (2022, 2023, 2024, and 2025), including sending a record six teams in 2024.
For context, the MW is one of six leagues (ACC, Big East, Big 12, Big Ten, SEC being the others) to have at least four teams in each of the last four NCAA tournaments. The league also went 2-1 in the NCAA Round of 64 in 2025, marking the second straight season that multiple teams advanced to the second weekend.
And who can forget about the unbelievable run San Diego State made to the National Championship game in 2023?

But as the MW is coming down the final stretch of conference play, the chances of sending four or multiple teams to the tournament is looking bleak.
As of right now, Utah State is the only team currently receiving votes in the Associated Press Top 25 and in the USA Today Coaches poll. They also seem to be the only likely conference candidate to receive an at-large invitation (even if they lost in the MW Tournament). Their overall metrics and resume have them safely in the field and not hovering near the bubble line.
That is not to say that San Diego State nor New Mexico don’t have a chance to receive an at-large bid, but their margin for error is nearly gone (but also not ZERO).
That margin for error has increasingly impacted the mid-majors in a negative way over the last few years because of the lack of quality non-conference opportunities and the natural bias of the selection committee’s view on Power 4 conferences. So mid-majors have to look for any advantage or strategy they can in order to stay in the conversation.
For example, just this week, Utah State’s Jared Calhoun was criticized for “running up the score” on Memphis in a 99-75 win on February 14th in Logan, UT. Memphis head coach Penny Hardaway lashed out after that game, “You can’t keep scoring the ball,” Hardaway said in his postgame radio interview. “You gotta have more class than that. You’ve just gotta have some type of class, seriously.”

Calhoun's response to the comment, points to today’s new metric-obsessed game and sparked national attention.
“Unfortunately, the way the rules are written with the analytics—the last two baskets, we would not have scored if this was a normal circumstance,” Calhoun said.“The deck is stacked totally against mid-majors now. You’ve got teams that have $10 and $20 million rosters; we don’t have that. We don’t have the ability to play a bunch of Quad 1 and Quad 2 games; we can’t get them. So we’re measured … we almost have to be perfect, let’s call it like it is. The Power Fours can lose 12, 13 games, we can lose five, right? So every possession is measured, and we’ve got to score the ball there, unfortunately. We play by the rules. Those are the rules that KenPom and Bart Torvik and the NCAA selection committee want us to play by. I would never have done that to coach Hardaway, but (that’s the system).”
So who does the system, Calhoun is referring to, actually favor? And how is it measured?
For so long, college basketball fans defaulted to the overall NET rankings - it is a primary tool used that focuses on team value index (results) and adjusted net efficiency and performance to rank teams. But as we’ve come to learn, there are six other metrics utilized to determine final selections: KenPom, ESPN BPI, Torvik (T-Rank), KPI, Strength of Record (SOS), and Wins Above Bubble (WAB).
On Thursday morning at the NCAA headquarters, the NCAA leadership team met with selected media members to produce a mock NCAA tournament exercise on selection process - a 68 team selection model going over principles, considerations, and general approach.
Out of all the statistics and metrics utilized, one was emphasized the most: Wins Above Bubble (WAB).
Dan Gavitt, an NCAA senior vice president of basketball who oversees the operation and management of the NCAA Tournament, described WAB as “Wins Above Bubble is important, especially from the selecting of teams… when it gets to seeding, the predictive [metrics] are a little more important.”
In a recent article published by CBS Sports (Why college basketball fans should master Wins Above Bubble: WAB is the new factor in NCAA Tournament selection), Gavitt said “I think fans would probably be pretty surprised that the selection of the at-large teams was more highly correlated to a team’s WAB ranking than it was their NET ranking.”
While WAB might not be new, it’s been used in some of the most recent selection processes, but it is now being framed as one of the more heavily weighted primary factors.
How does WAB work?
By CBS Sports definition, “Using a combination of each opponent's strength and the location of the game, WAB puts a 0-1 score on each game based on how likely the standard bubble team (No. 45 NET) would be to win. Big-time opponents bring big-time WAB payouts for wins and relatively small WAB hits for losses.” It’s unaffected by margin of victory (unlike the NET), and it measures what you’ve accomplished against your schedule vs. what an average bubble team would have accomplished with the same schedule.
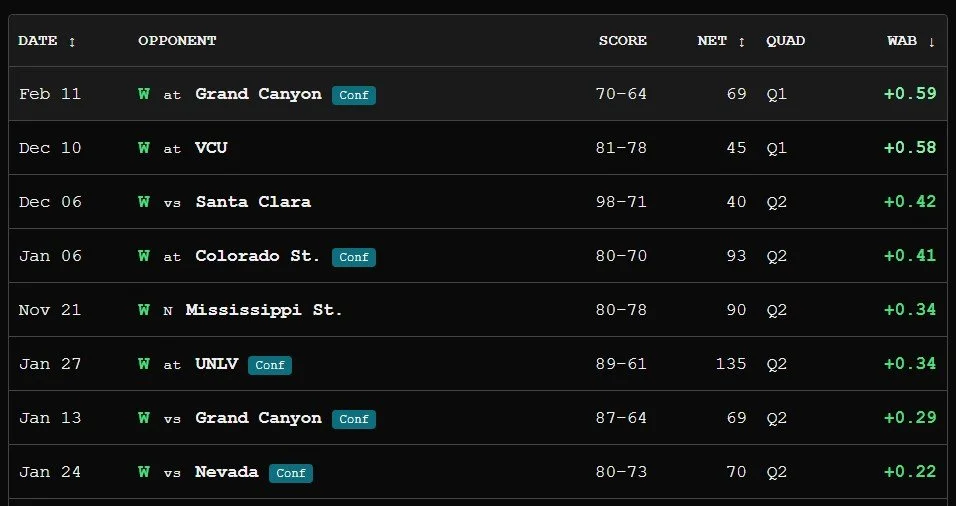
For example, New Mexico’s 70-64 win at GCU is worth +0.59 WAB - meaning that an average bubble team would only be expected to win that game 41% of the time. The WAB statistic accumulates throughout the season and ranks teams success rates.
The WAB ratings are publicly posted on the NCAA website.
WAB Watch (Mountain West only)
#25 Utah State +3.17 WAB
#48 New Mexico +0.55 WAB
#53 San Diego State +0.01 WAB
#63 Boise State -1.39 WAB
#66 Grand Canyon -1.64 WAB
#73 Nevada -2.14 WAB
#88 Colorado State -3.56 WAB
New Mexico WAB Profile
Of the five remaining games on UNM’s schedule, WAB projects that the Lobos can improve their total WAB by +2.15, which would put them #33 nationally (theoretically) if they win out.
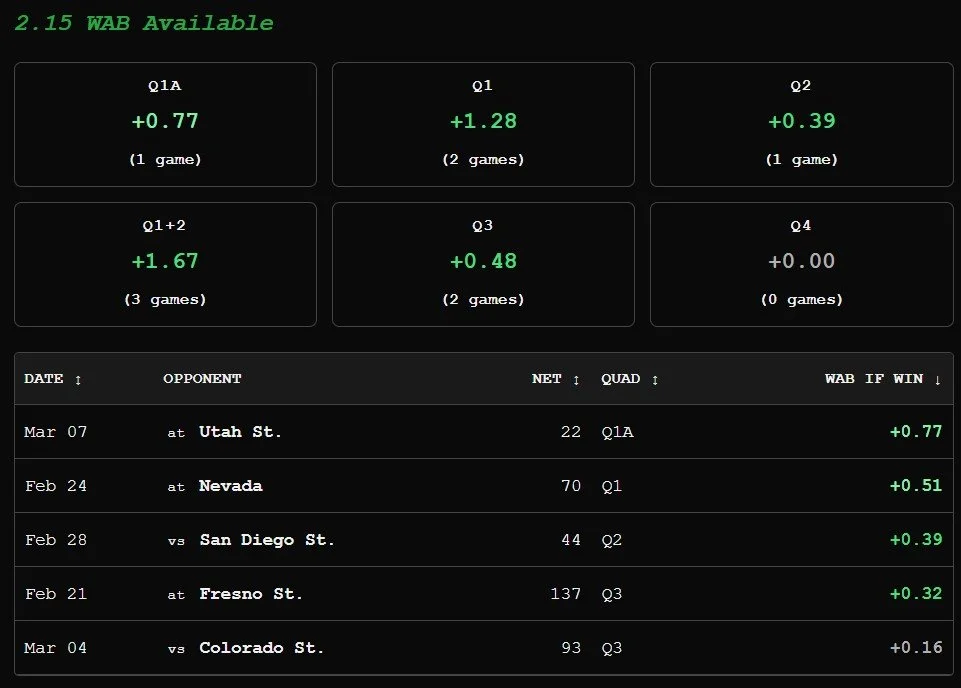
With two Quad 1 games (@ Utah State Q1-A, @ Nevada) left on their schedule and a home Quad 2 (San Diego State), the Lobos still control their own destiny.
No one likes to fall back on the idea of having to win 3-4 games in the MW tournament in order to secure an auto-bid to The Dance, but sometimes it's the only way to punch a ticket.
But with still so much to play for at the end of the year, every game and every possession matters more than the last.
AIR FORCE RECAP, FRESNO STATE PREVIEW, LOBOS ON BUBBLE WATCH!